How to Deploy an Observability Stack using Docker Compose behind Caddy v2.6.4
Find and identify operational issues or security breaches before they impact your users by deploying a robust, open-source Observability Stack.
Find and identify operational issues or security breaches before they become critical problems that impact your customers.
Today, I am going to show you how to deploy an end-to-end Observability Stack consisting of Quickwit, Jaeger, OpenTelemetry, Loki, Grafana, and Prometheus. It is incredibly important to monitor application logs, metrics, and traces for smooth, highly-available functioning.
This observability stack helps us find errors and fix them before the client catches them. In modern environments, this deep visibility is largely powered by distributed tracing.
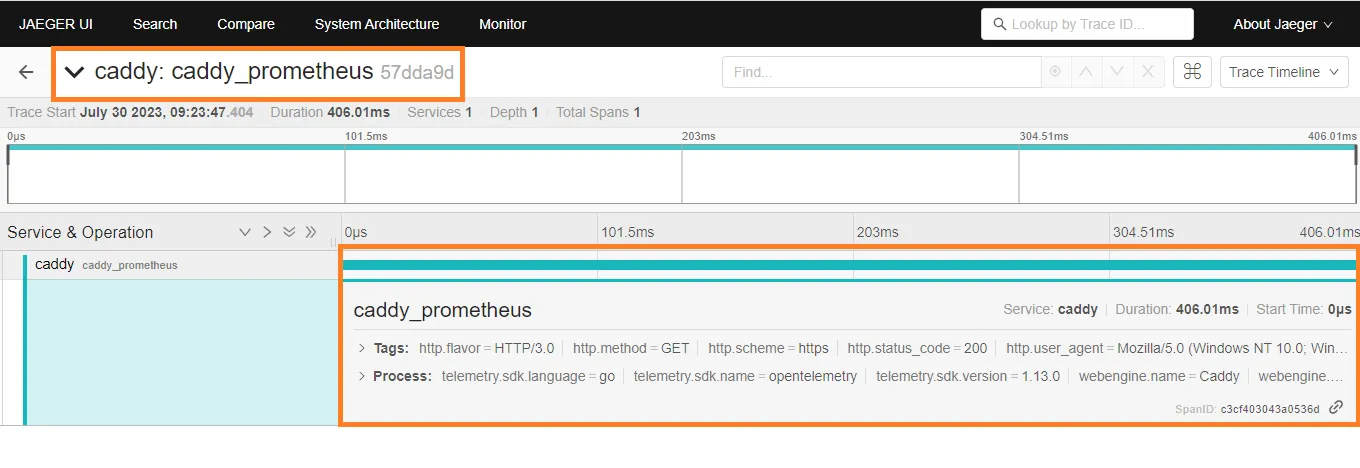
Distributed tracing is a method of tracking or identifying how requests propagate from the frontend (in our case, the Caddy Reverse Proxy) to backend services and databases.
Observability enables developers and sysadmins to see exactly how an individual request is handled by analyzing the gathered logs or by looking into the execution spans via their external trace IDs.
Monitor and troubleshoot requests across large distributed systems.
Let’s start with the actual deployment.
Prerequisites
We will be using the following open-source tools to build our Observability Stack via Docker Compose. Ensure you have the basics ready:
- An Ubuntu Server (or any Linux flavor).
- Docker and Docker Compose installed on the server.
- Caddy configured as a reverse proxy to securely expose our microservices.
If you want to learn more about each component in the stack, please refer to the links below:
Introduction
Observability is the ability to collect data about a program’s execution, the internal state of applications, and the communication among individual components in a distributed environment. To improve observability, DevOps engineers use a wide range of logging and tracing techniques to gather telemetry data, and tools to analyze that data to improve performance.
Here, I am using:
- Quickwit as the highly scalable storage backend for Jaeger.
- OpenTelemetry (OTel) to collect data (logs, metrics, and traces) from our Docker containers.
- Loki & Promtail to gather logs from the containers (using
flogto generate sample logs). - Grafana to create beautiful dashboards.
- Prometheus to scrape and monitor metrics.
Why Observability is Important
Observability allows us to identify potential problems proactively. Instead of waiting for users to report bugs, observability helps dev teams understand exactly how their systems behave in the production environment, allowing for rapid root-cause analysis.
Prepare the Environment
I typically use the /opt directory to place configuration files like docker-compose.yml, prometheus.yml, otelconfig.yaml, and data folders for container persistence.
Create the necessary configuration directory:
cd /opt
sudo mkdir -p caddy-observability
cd caddy-observability
sudo touch docker-compose.yml
Observability Stack Docker Compose
Open docker-compose.yml with your editor:
sudo nano docker-compose.ymlCopy and paste the following code. This file ties all the observability microservices together.
version: "3.7"

services:
  quickwit:
    image: quickwit/quickwit
    command: run
    container_name: quickwit
    restart: unless-stopped
    volumes:
      - ./quickwit-data:/quickwit/qwdata
    environment:
      - QW_ENABLE_OPENTELEMETRY_OTLP_EXPORTER=true
      - OTEL_EXPORTER_OTLP_ENDPOINT=http://quickwit:7281
      - QW_ENABLE_OTLP_ENDPOINT=true
      - QW_ENABLE_JAEGER_ENDPOINT=true
      - QW_DISABLE_TELEMETRY=1
    networks:
      - inet
    depends_on:
      caddy:
        condition: service_started

  jaeger:
    image: jaegertracing/jaeger-query:latest
    container_name: jaeger
    restart: unless-stopped
    environment:
      - SPAN_STORAGE_TYPE=grpc
      - GRPC_STORAGE_SERVER=quickwit:7281
      - COLLECTOR_ZIPKIN_HOST_PORT=:9411
      - COLLECTOR_OTLP_ENABLED=true
      - METRICS_STORAGE_TYPE=prometheus
      - PROMETHEUS_SERVER_URL=http://prometheus:9090
      - PROMETHEUS_QUERY_SUPPORT_SPANMETRICS_CONNECTOR=true
    networks:
      - inet
    depends_on:
      caddy:
        condition: service_started

  otelcol:
    image: otel/opentelemetry-collector-contrib:latest
    container_name: otelcol
    restart: unless-stopped
    deploy:
      resources:
        limits:
          memory: 125M
    command: ["--config=/etc/otelcol-config.yaml"]
    volumes:
      - ./otelconfig.yaml:/etc/otelcol-config.yaml
    networks:
      - inet
    depends_on:
      caddy:
        condition: service_started

  loki:
    image: grafana/loki:latest
    container_name: loki
    restart: unless-stopped
    networks:
      - inet
    depends_on:
      caddy:
        condition: service_started

  flog:
    image: mingrammer/flog
    container_name: flog
    restart: unless-stopped
    command: -f json -d 1s -l
    networks:
      - inet
    depends_on:
      caddy:
        condition: service_started

  promtail:
    image: grafana/promtail:2.8.0
    container_name: promtail
    restart: unless-stopped
    volumes:
      - ./promtail-local-config.yaml:/etc/promtail/config.yaml:ro
    command: -config.file=/etc/promtail/config.yaml
    networks:
      - inet
    depends_on:
      caddy:
        condition: service_started

  grafana:
    image: grafana/grafana-oss:latest
    container_name: grafana
    restart: unless-stopped
    volumes:
      - ./grafana-data:/var/lib/grafana
    environment:
      - GF_SECURITY_ADMIN_USER=username
      - GF_SECURITY_ADMIN_PASSWORD=password
      - GF_SECURITY_ADMIN_EMAIL=user@example.com
      - GF_SECURITY_DISABLE_GRAVATAR=true
      - GF_SECURITY_DISABLE_BRUTE_FORCE_LOGIN_PROTECTION=true
      - GF_SECURITY_COOKIE_SECURE=TRUE
      - GF_SERVER_ENABLE_GZIP=true
      - GF_SERVER_ROOT_URL=[https://grafana.example.com](https://grafana.example.com)
      - GF_ANALYTICS_REPORTING_ENABLED=false
      - GF_USERS_ALLOW_SIGN_UP=false
      - GF_USERS_DEFAULT_THEME=light
      - GF_EXPLORE_ENABLED=true
      - GF_ALERTING_ENABLED=false
      - GF_UNIFIED_ALERTING_ENABLED=true
      - GF_FEATURE_TOGGLES_ENABLE=traceToMetrics,publicDashboards,tempoApmTable
    entrypoint:
      - sh
      - -euc
      - |
        mkdir -p /etc/grafana/provisioning/datasources
        cat <<EOF> /etc/grafana/provisioning/datasources/ds.yaml
        apiVersion: 1
        datasources:
          - name: Loki
            type: loki
            access: proxy
            url: http://loki:3100
        EOF
        /run.sh
    networks:
      - inet
    depends_on:
      loki:
        condition: service_started

  prometheus:
    image: prom/prometheus:latest
    container_name: prometheus
    restart: unless-stopped
    command:
      - "--config.file=/etc/prometheus/prometheus.yml"
      - "--web.enable-remote-write-receiver"
      - "--enable-feature=exemplar-storage"
    volumes:
      - ./prometheus.yml:/etc/prometheus/prometheus.yml
    networks:
      - inet
    depends_on:
      caddy:
        condition: service_started

  caddy:
    image: tuneitme/caddy
    restart: unless-stopped
    container_name: caddy
    ports:
      - target: 80
        published: 80
        mode: host
      - target: 443
        published: 443
        mode: host
      - target: 443
        published: 443
        mode: host
        protocol: udp
      - target: 2019
        published: 2019
        mode: host
    networks:
      - caddy
      - inet
    volumes:
      - ./Caddyfile:/etc/caddy/Caddyfile
      - ./caddydata:/data
      - ./caddyconfig:/config
      - ./caddylogs:/var/log/caddy
    environment:
      - OTEL_SERVICE_NAME=caddy
      - OTEL_EXPORTER_OTLP_TRACES_ENDPOINT=http://quickwit:7281

volumes:
  caddydata:
  caddyconfig:
  caddylogs:
  grafana-data:
  quickwit-data:

networks:
  caddy:
    external: true
  inet:
    driver: bridge
You will notice I used depends_on heavily to control startup sequence dependencies between services. Specifically, I ensure the caddy reverse proxy starts before everything else.
Caddyfile Configuration
Here is the production-ready Caddyfile that exposes our observability endpoints securely.
sudo touch Caddyfile
sudo nano Caddyfile
Paste the following configuration:
{
    email user@example.com
    default_sni anything
    cert_issuer acme
    acme_ca [https://acme-v02.api.letsencrypt.org/directory](https://acme-v02.api.letsencrypt.org/directory)
    servers {
        metrics
        protocols h1 h2c h3
        strict_sni_host on
        trusted_proxies cloudflare {
            interval 12h
            timeout 15s
        }
    }
    admin 0.0.0.0:2019
}

prometheus.example.com {
    encode gzip zstd
    tracing {
        span caddy_prometheus
    }
    reverse_proxy prometheus:9090
}

grafana.example.com {
    encode gzip zstd
    tracing {
        span caddy_grafana
    }
    reverse_proxy grafana:3000
}

jaeger.example.com {
    encode gzip zstd
    tracing {
        span caddy_jaeger
    }
    reverse_proxy jaeger:16686
}
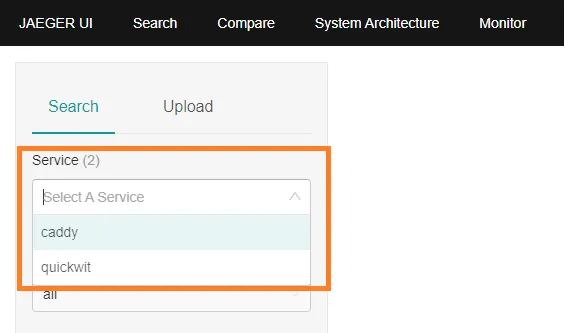
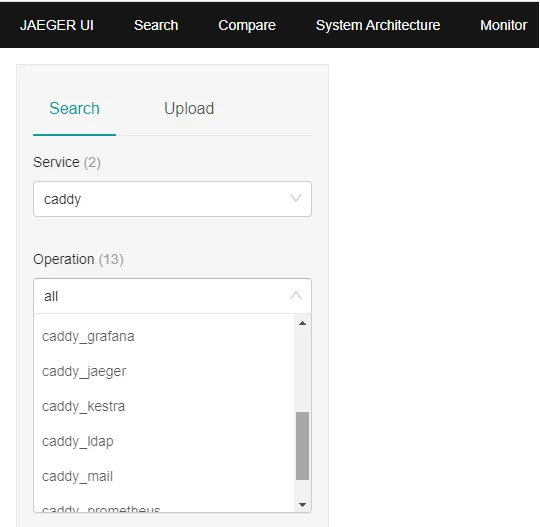
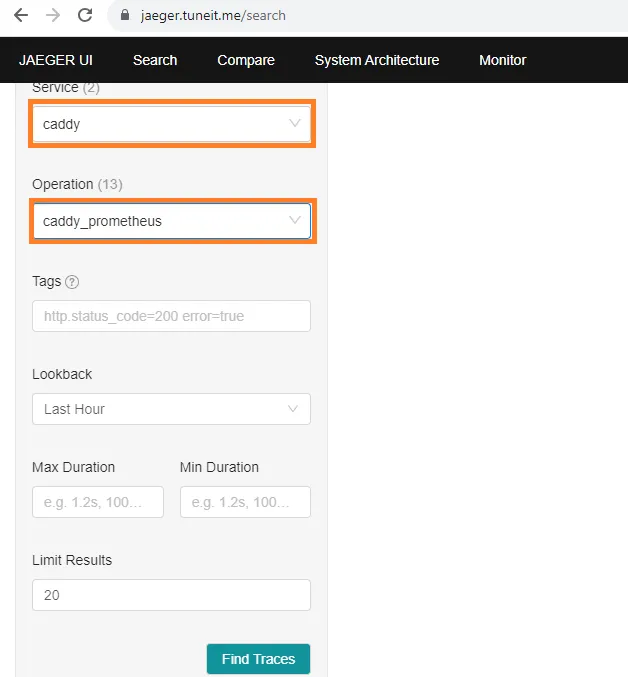
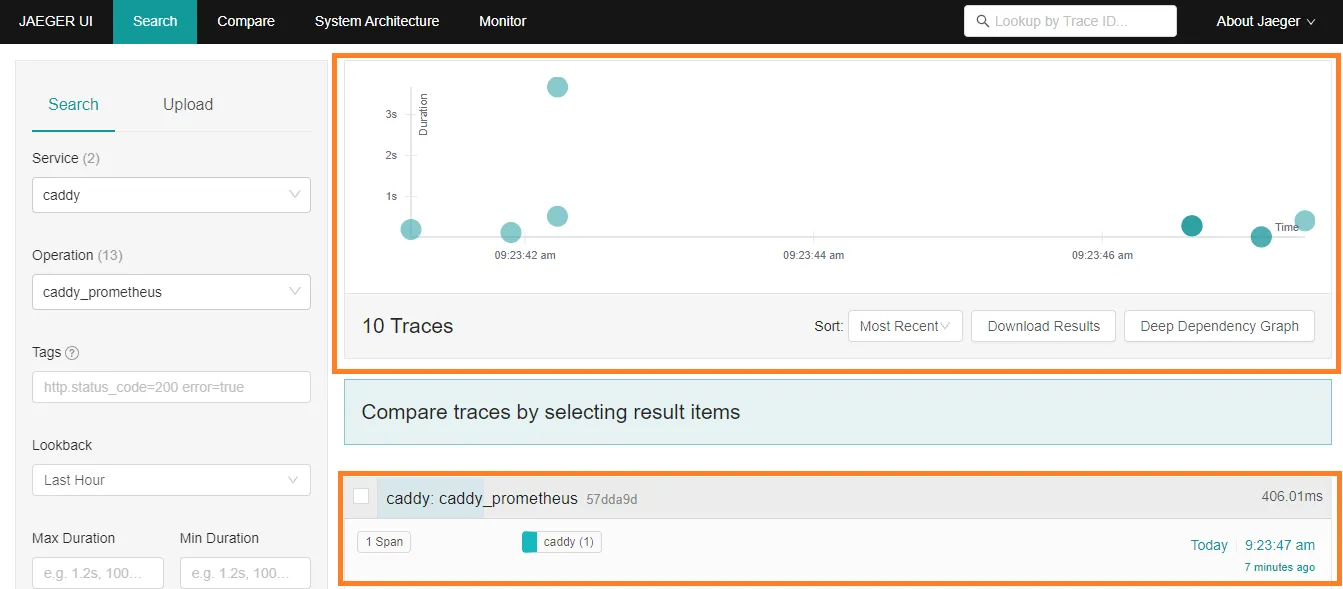
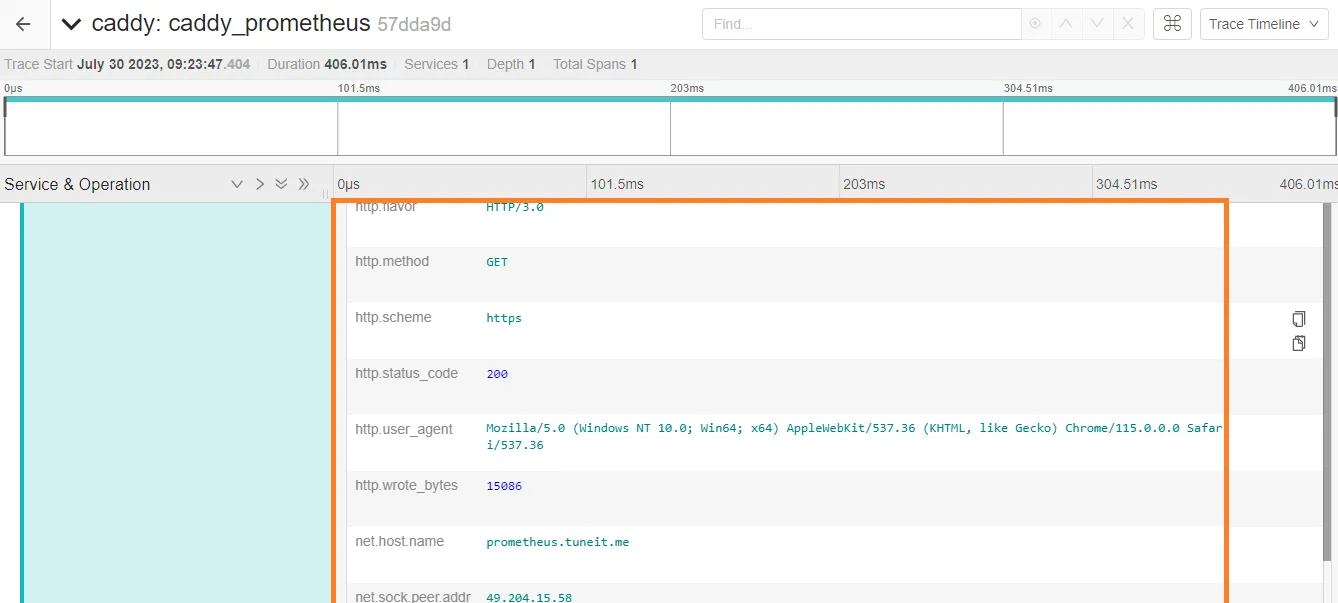
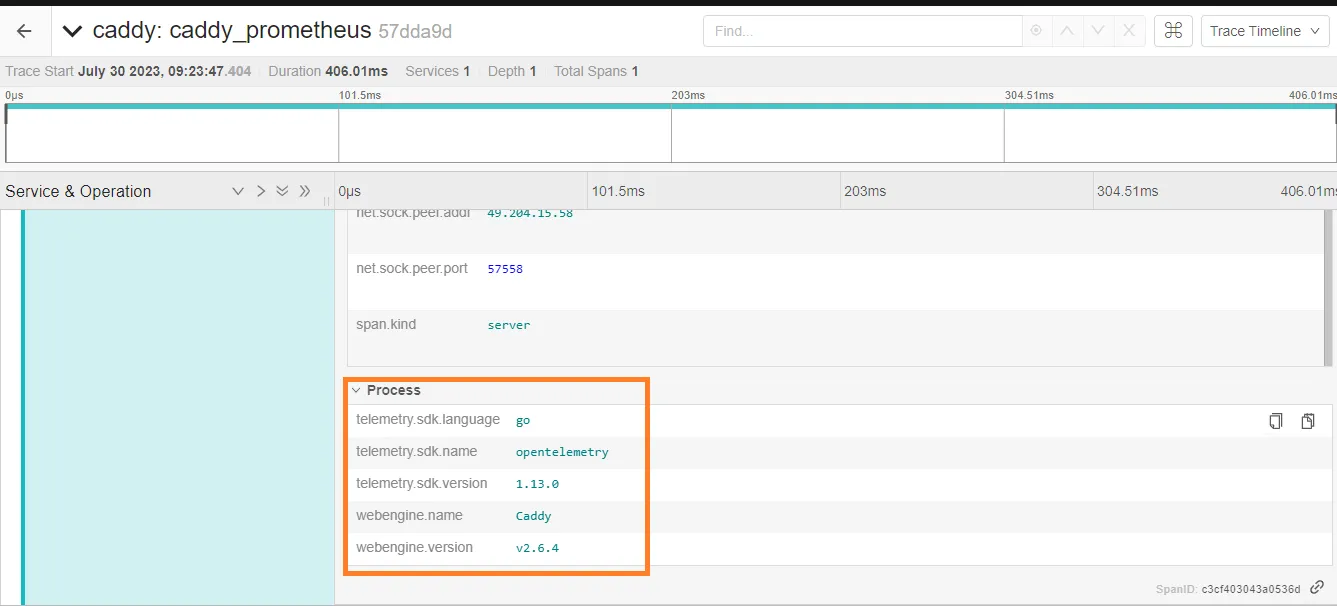
Notice the tracing { span caddy_* } blocks in the Caddyfile. Caddy natively supports OpenTelemetry! It will emit tracing spans for every HTTP request directly to our Quickwit storage backend.
Supporting Configuration Files
We need a few more configuration files before we can deploy the stack.
1. OpenTelemetry Configuration (otelconfig.yaml)
sudo nano otelconfig.yaml receivers:
loki:
protocols:
http:
use_incoming_timestamp: true
otlp:
protocols:
grpc:
http:
processors:
batch:
attributes:
actions:
- action: insert
key: loki.attribute.labels
value: container
- action: insert
key: loki.format
value: json
exporters:
loki:
endpoint: http://loki:3100/loki/api/v1/push
otlp/quickwit:
endpoint: quickwit:7281
tls:
insecure: true
prometheus:
endpoint: "0.0.0.0:8889"
service:
pipelines:
logs:
receivers: [loki]
processors: [attributes]
exporters: [loki]
traces:
receivers: [otlp]
processors: [batch]
exporters: [otlp/quickwit]2. Promtail Configuration File (promtail-local-config.yaml)
sudo nano promtail-local-config.yaml server:
http_listen_port: 9080
grpc_listen_port: 0
positions:
filename: /tmp/positions.yaml
clients:
- url: http://otelcol:3500/loki/api/v1/push
scrape_configs:
- job_name: flog_scrape
docker_sd_configs:
- host: unix:///var/run/docker.sock
refresh_interval: 5s
relabel_configs:
- source_labels: ['__meta_docker_container_name']
regex: '/(.*)'
target_label: 'container'3. Prometheus Configuration File (prometheus.yml)
sudo nano prometheus.yml global:
scrape_interval: 15s
evaluation_interval: 15s
scrape_configs:
- job_name: 'opentelemetry-collector'
static_configs:
- targets: ["otelcol:8888"]
- job_name: 'prometheus'
static_configs:
- targets: ['prometheus:9090']
- job_name: 'caddy'
static_configs:
- targets: ['caddy:2019']Deploy the Observability Stack
Now it’s time to deploy the stack using Docker Compose:
sudo docker compose up -dCheck the status of each service to ensure everything started properly:
docker psAccess the Applications
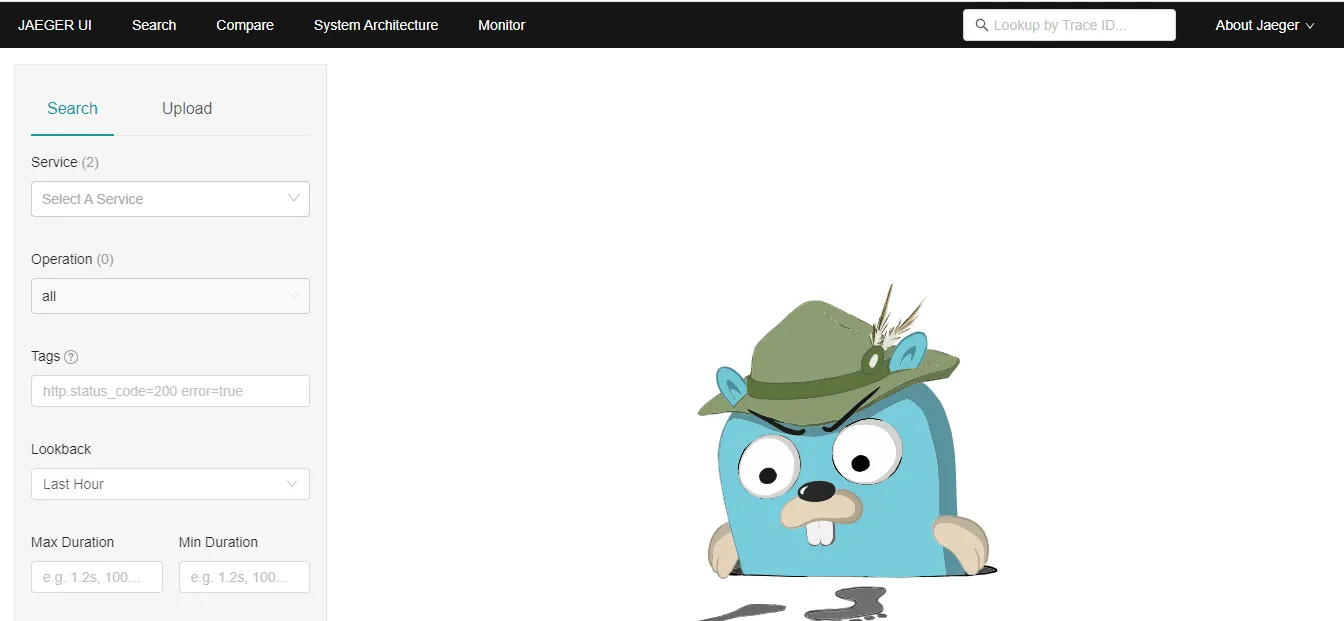
Ensure that you have created DNS entries (A or CNAME records) for jaeger.example.com, grafana.example.com, and prometheus.example.com in your DNS management console.
Traefik/Caddy will secure them automatically.
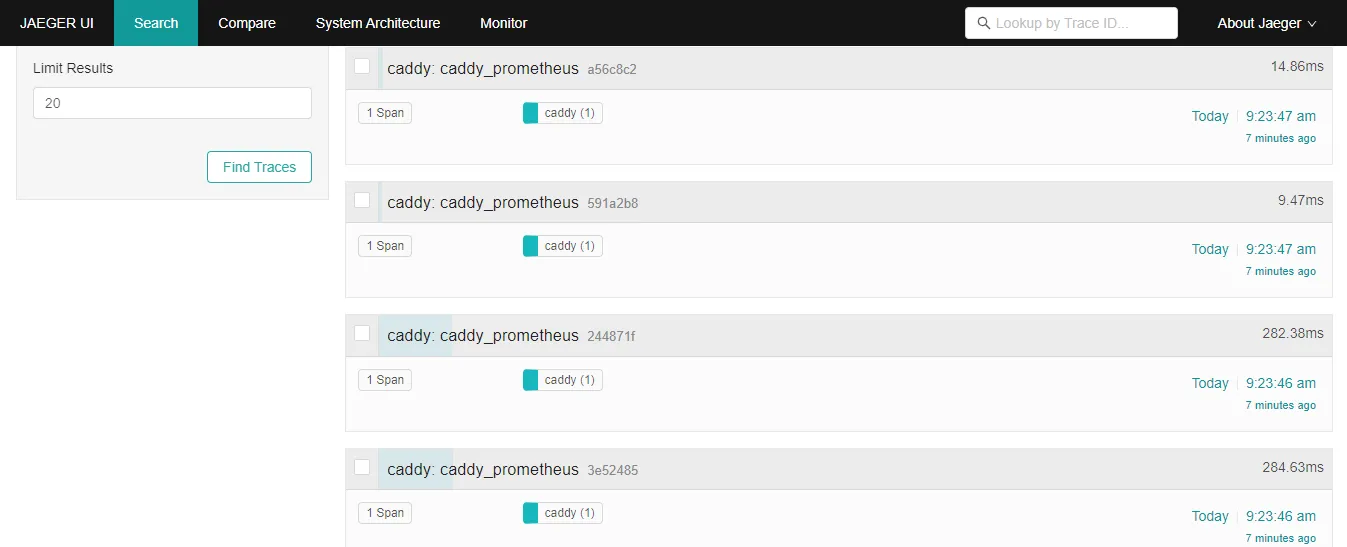
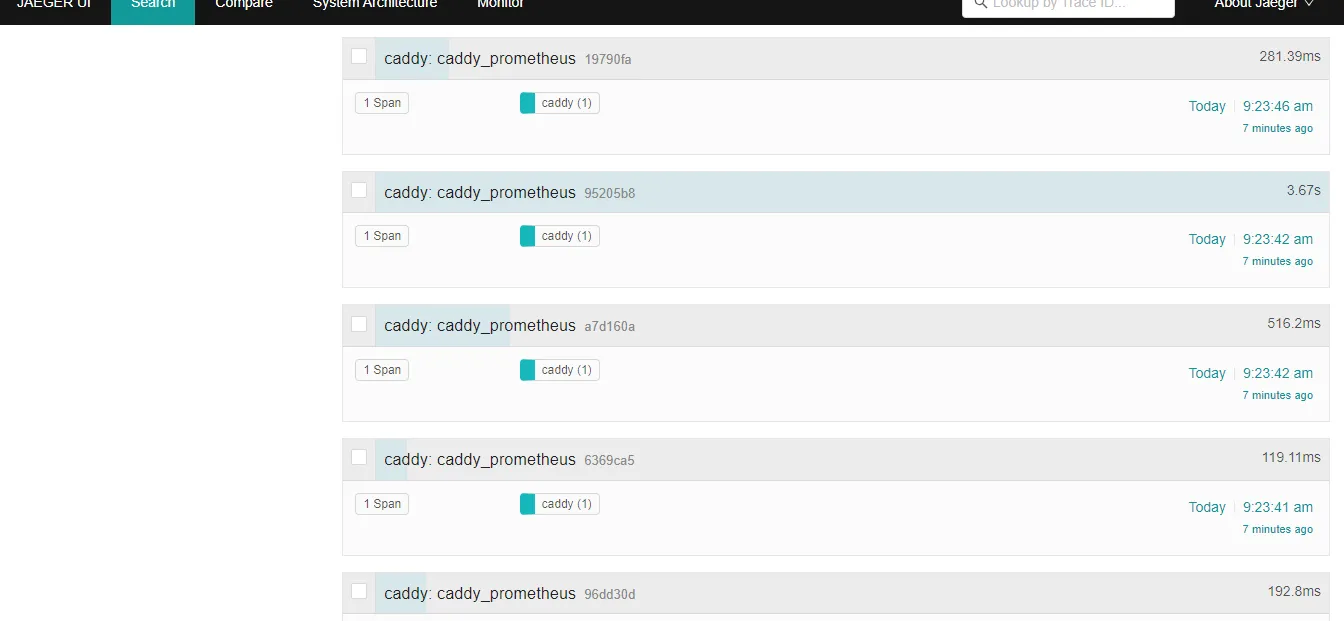
Jaeger Interface
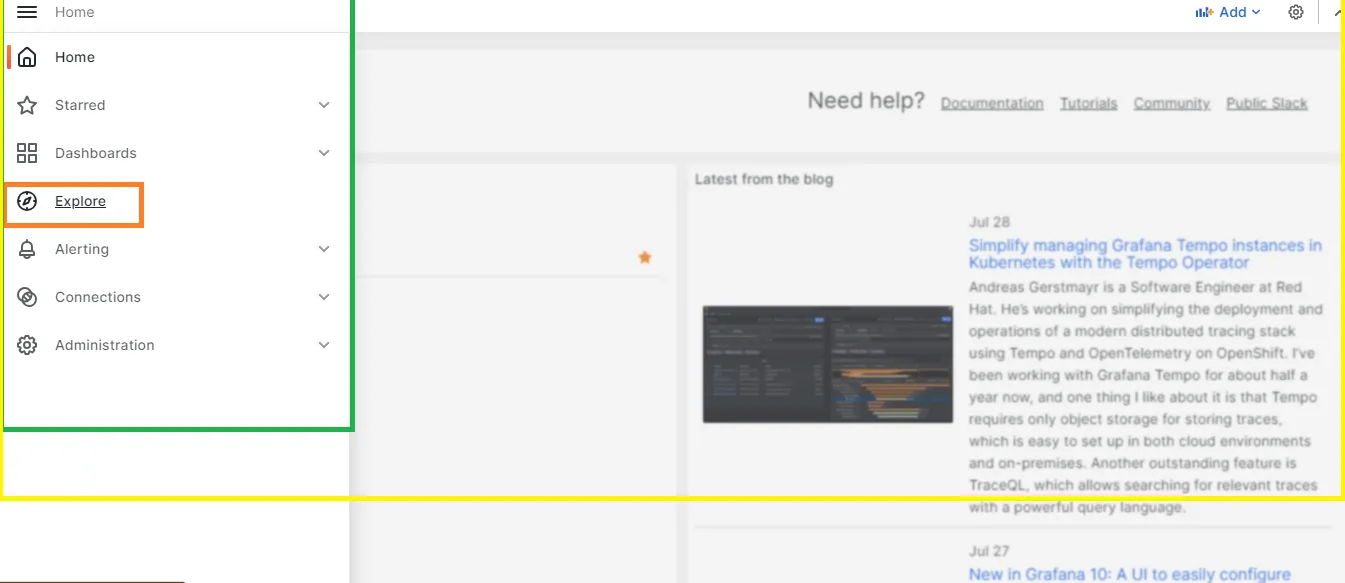
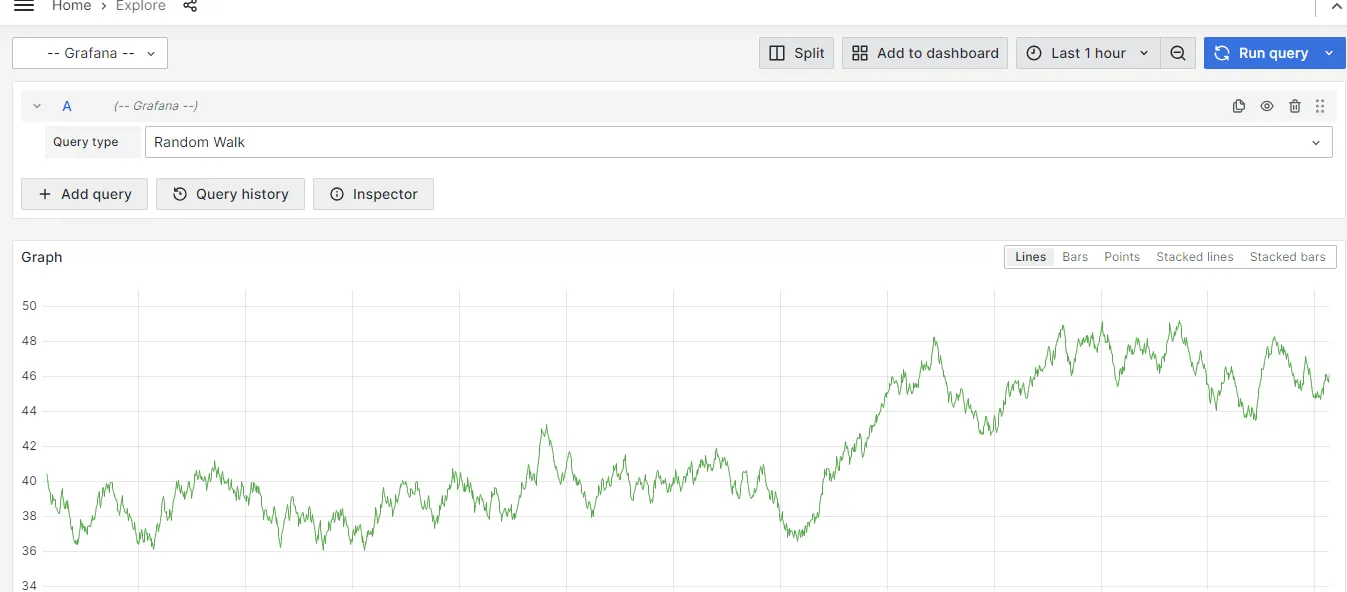
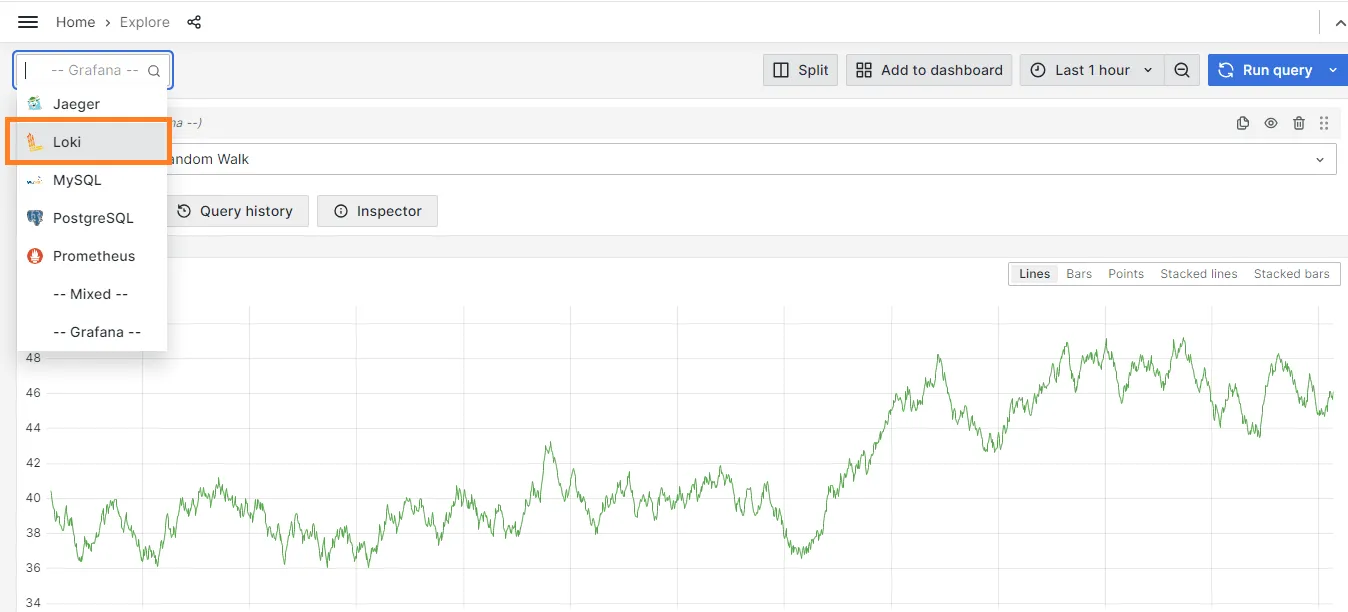
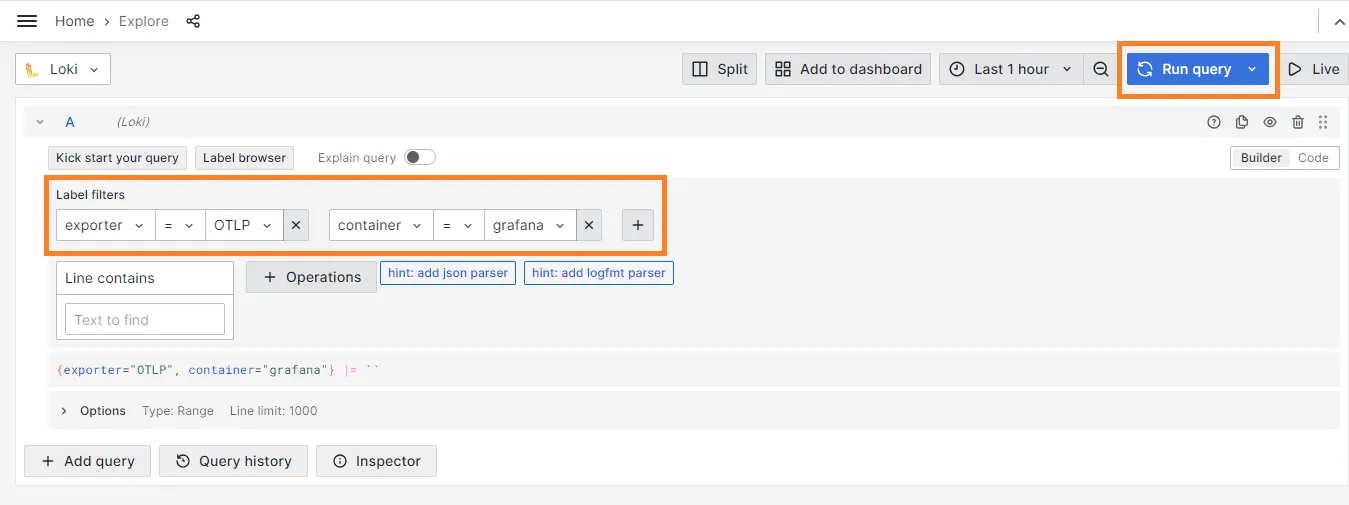
Grafana Dashboards
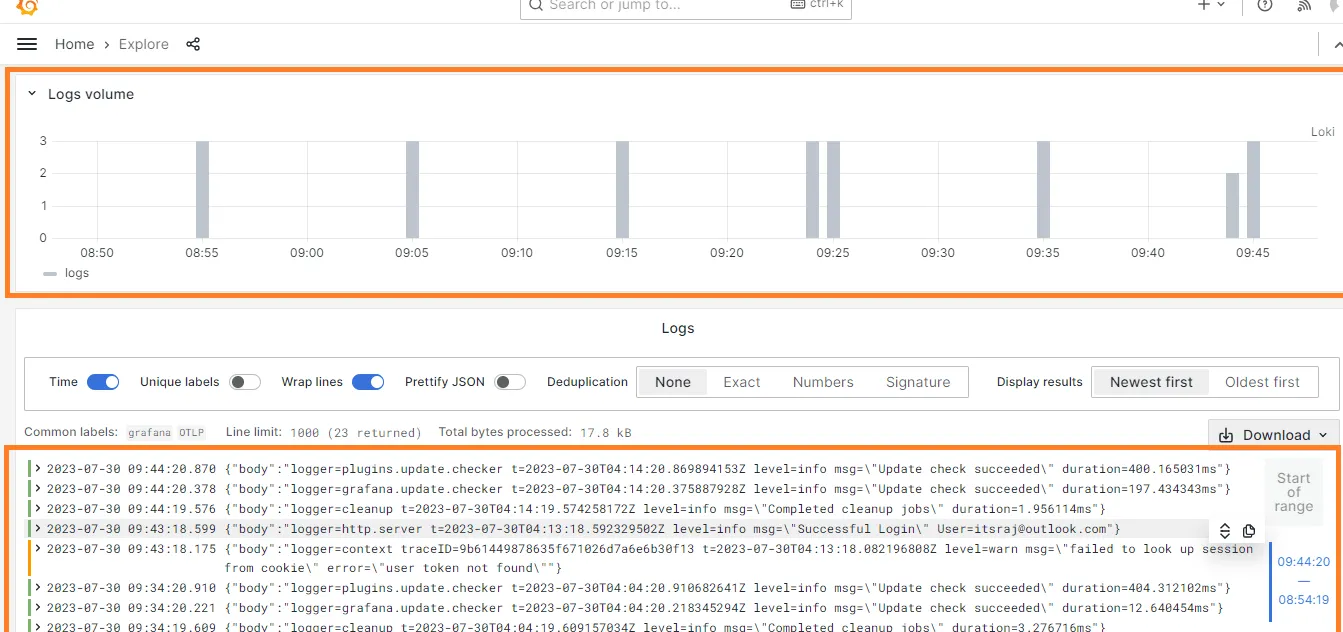
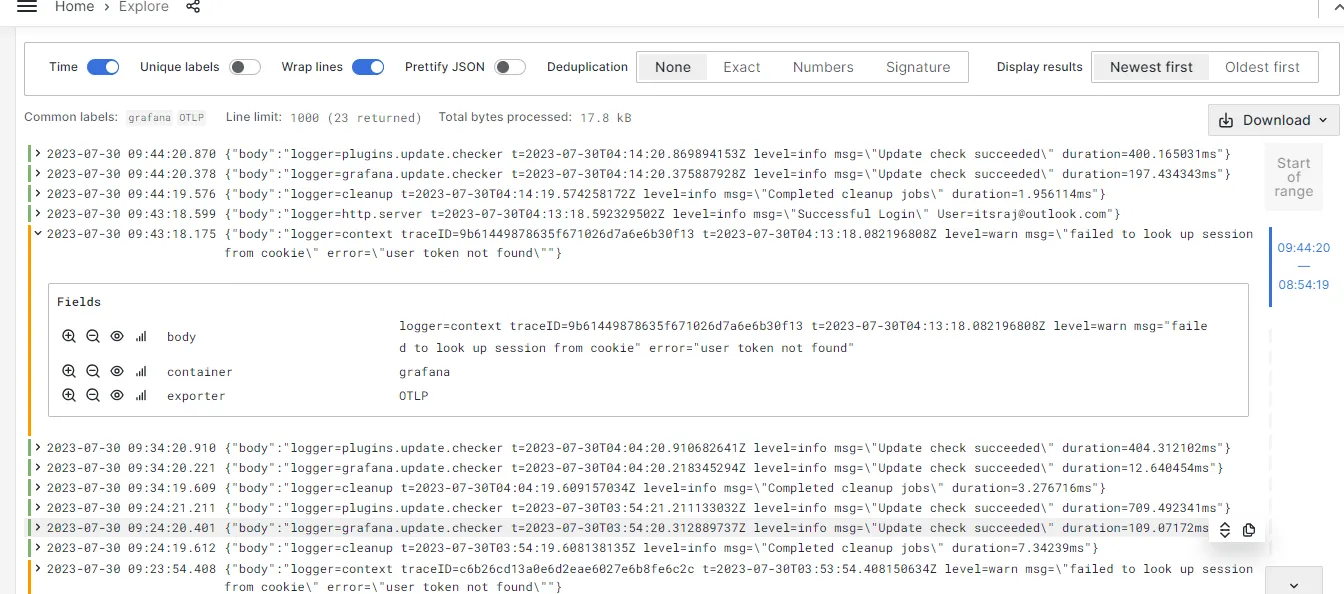
Prometheus Metrics
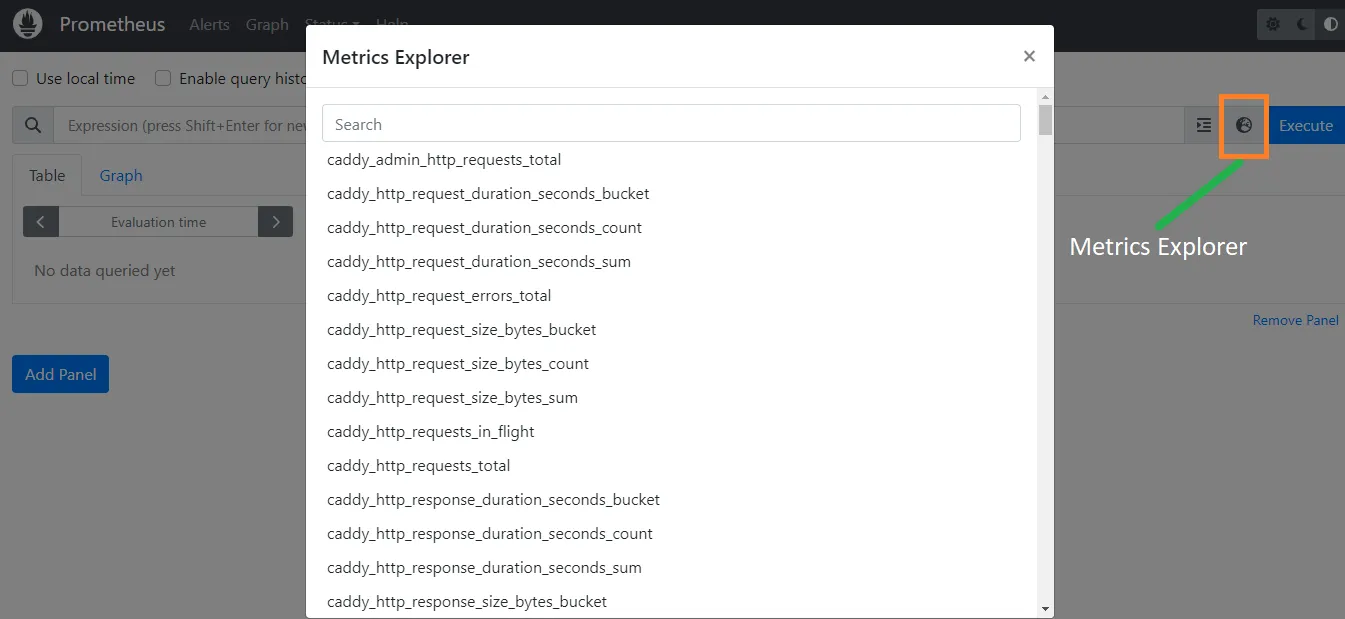
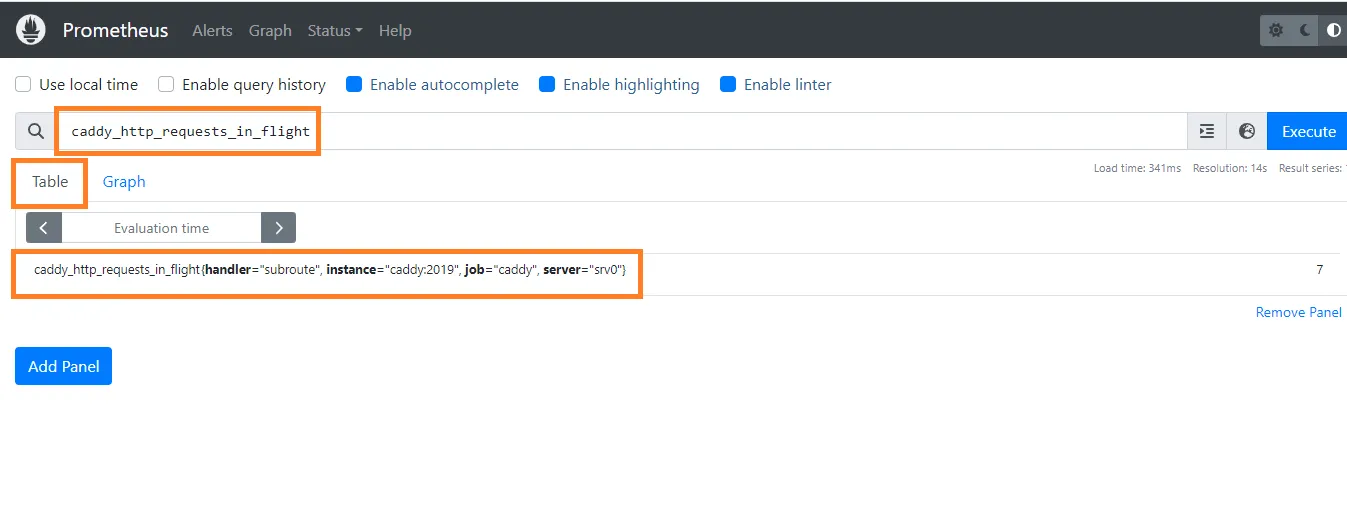
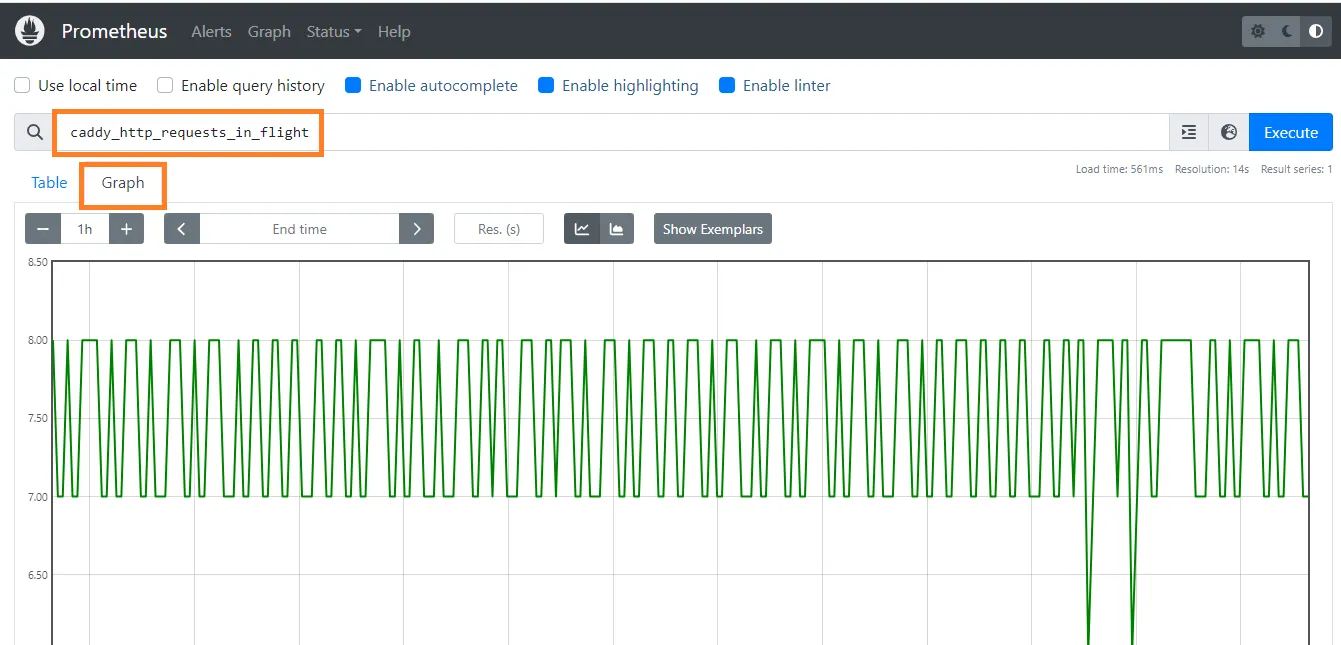
I hope you enjoyed this tutorial! Let me know your thoughts or any issues you encountered by commenting below.
Stay tuned for more open-source deployments in upcoming posts!

Continue reading

How to Deploy Authelia Using Docker Compose Behind Caddy
Authelia is an open-source authentication and authorization server providing two-factor authentication and single sign-on (SSO) for applications via a web portal.

How to Self-Host Stalwart Mail Server Using Docker Compose Behind Caddy v2.8.4
Stalwart is an open-source mail server solution with JMAP, IMAP4, POP3 & SMTP support. It is written in Rust and aims to be secure, fast, robust, and scalable.

How to Deploy Jenkins v2.426.2 in Docker Swarm Behind Caddy v2.7.6
Jenkins is a popular open-source automation server written in Java. Learn how to deploy a highly available CI/CD pipeline engine using Docker Swarm and Caddy.